728x90
랜덤포레스트 문제(상한 개사료)
여러분은 왜 개 사료가 예상보다 빨리 상하게 되는지를 파악하기위해 개 사료 회사에 고용되었습니다. 안 좋은 소식은 이 회사는 한동안 장비를 업그레이드 하지 않았습니다. 즉, 이 회사에서 사용하는 5가지 방부제의 사용 용량이 중구난방이라는 뜻입니다. 하지만 그 중에서 가장 많은 영향을 끼치는 것이 무엇일까요?
이 회사에서는 먼저 4가지 방부제(A, B, C, D)가 함유된 방부제 묶음을 섞은 뒤 '필러'라는 화학물질로 마무리합니다. 식품과학자들은 A, B, C, D 방부제 중 하나가 문제를 일으키고 있다고 생각하지만, 그게 어떤 것인지 명확하게 하기위해 여러분이 고용됐습니다. "랜덤포레스트"로 어떤 방부제가 사료를 빨리 상하게 하는지 찾아보세요!
- Pres_A : 혼합물의 A비율
- Pres_B : 혼합물의 B비율
- Pres_C : 혼합물의 C비율
- Pres_D : 혼합물의 D비율
- Spoiled : 개 사료가 상했는지 여부를 나타내는 레이블.
시나리오에서 요구하는 바를 고려하여, 머신러닝을 이용해서 문제를 풀어보세요.
from sklearn.ensemble import RandomForestClassifier
import pandas as pd
import matplotlib.pyplot as plt
import seaborn as sns
from scipy import stats
from sklearn.linear_model import LogisticRegression
from sklearn.model_selection import train_test_split
from sklearn.metrics import classification_report
import numpy as np
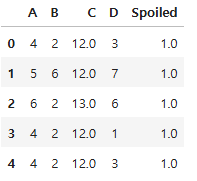
df = pd.read_csv("./data/dog_food.csv")
df.head()
df.describe()

boxplot
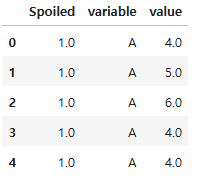
ndf = df.melt(id_vars = "Spoiled")
ndf.head()
plt.figure()
sns.boxplot(data = ndf, x = "variable", y = "value", hue = "Spoiled")
plt.show()
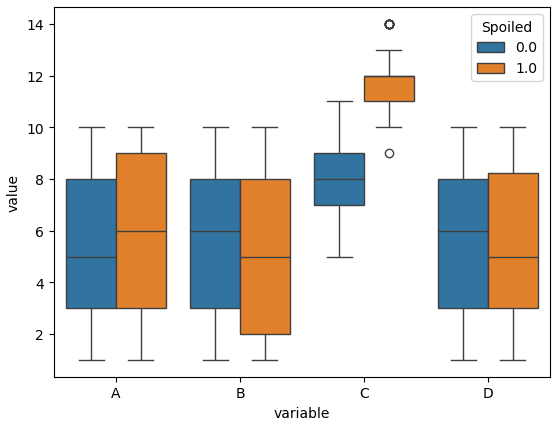
# A, B의 경우 상한것과 상하지 않은것의 차이가 별로 없다
# C의 경우 상한것과 상하지 않은 것의 차이가 크다
pairplot
plt.figure()
sns.pairplot(df, hue = "Spoiled")
plt.show()
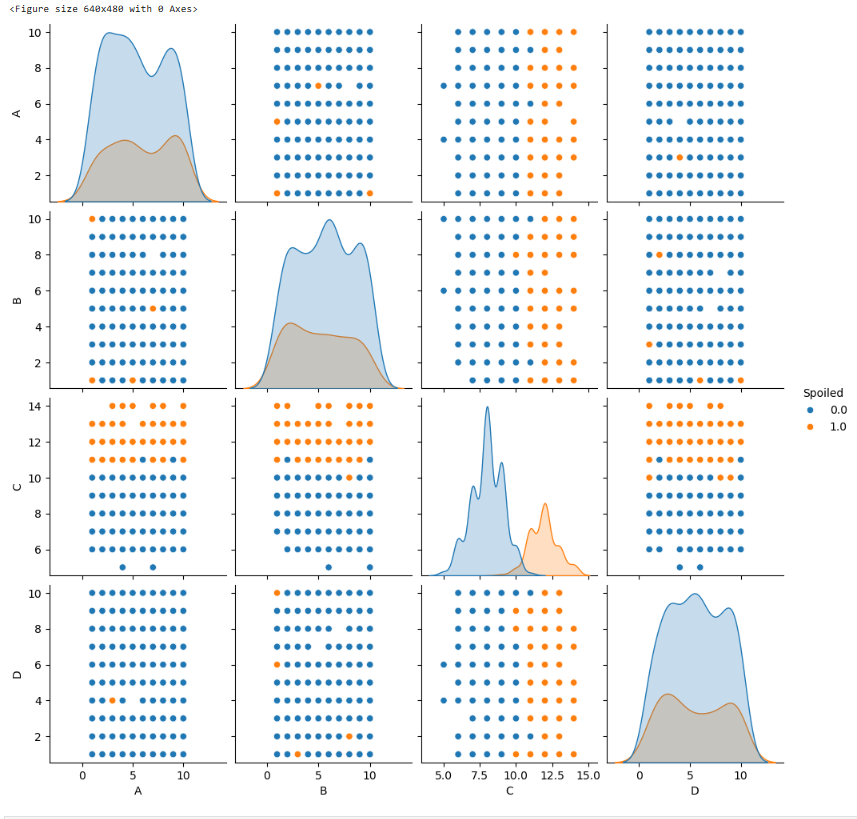
# C만 분포가 다름
# 점이 무작위로 퍼져있으면 관계가 없다고 볼 수 있다
통계 검정
spoiled = df[df["Spoiled"] == 1]
normal = df[df["Spoiled"] == 0]
stats.bartlett(spoiled["C"], normal["C"])
BartlettResult(statistic=2.433612464987765, pvalue=0.11875893707243139)
# pvalue가 0.05보다 크면 등분산성을 만족
stats.ttest_ind(spoiled["C"], normal["C"], equal_var = True)
TtestResult(statistic=37.00175815922425, pvalue=1.0006887690101255e-143, df=488.0)
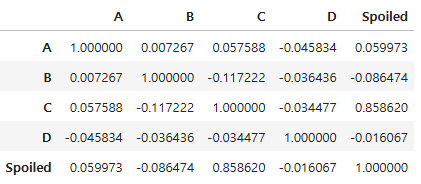
상관계수
df.corr()
모델
x = df.drop("Spoiled", axis = 1)
y = df["Spoiled"]
x_train, x_test, y_train, y_test = train_test_split(x, y, test_size = 0.2, stratify = y, random_state = 26)
x_train.shape, x_test.shape
((392, 4), (98, 4))
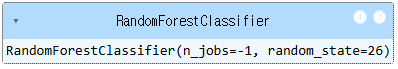
RandomForest
rf = RandomForestClassifier(n_jobs = -1, random_state = 26)
rf.fit(x_train, y_train)
rf.score(x_test, y_test)
0.9795918367346939
pred = rf.predict(x_test)
print(classification_report(y_test, pred))
              precision    recall  f1-score   support

         0.0       0.99      0.99      0.99        70
         1.0       0.96      0.96      0.96        28

    accuracy                           0.98        98
   macro avg       0.98      0.98      0.98        98
weighted avg       0.98      0.98      0.98        98
rf.feature_importances_
array([0.03192827, 0.02858564, 0.90340012, 0.03608597])
LogisticRegression
logi = LogisticRegression()
logi.fit(x_train, y_train)
logi.score(x_test, y_test)
0.9795918367346939
logi.score(x_train, y_train)
0.9821428571428571
logi.coef_
array([[-0.07585524, -0.05000739, 3.39193101, 0.01060048]])
np.exp(logi.coef_)
array([[ 0.92695038, 0.95122239, 29.72329289, 1.01065687]])# C가 1증가하면 상할 가능성이 29.72배 됨
'08_ML(Machine_Learning)' 카테고리의 다른 글
| 24_파이프라인 구축 (0) | 2025.04.11 |
|---|---|
| 23_서포트 벡터 머신 (0) | 2025.04.11 |
| 21_트리 앙상블 (0) | 2025.04.10 |
| 20_교차검증_그리드서치 (0) | 2025.04.10 |
| 19_의사 결정 나무 (2) | 2025.04.09 |