728x90
기온 데이터 분석
# 기상자료개방포털>기후통계분석>기온분석
# https://data.kma.go.kr/cmmn/main.do
import pandas as pd
import matplotlib.pyplot as plt
import numpy as np
# Windows용 한글 폰트 오류 해결
from matplotlib import font_manager, rc
font_path = "C:/Windows/Fonts/malgun.ttf"
font_name = font_manager.FontProperties(fname = font_path).get_name()
rc("font", family = font_name)
데이터 확인
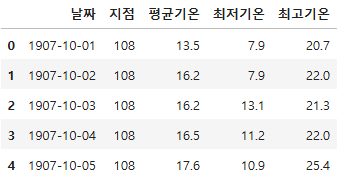
df = pd.read_csv("./data/seoul.csv", skiprows = 6, encoding = "cp949")
df.head()

df.shape
(42473, 5)
df.dtypes
날짜          object
지점           int64
평균기온(℃)    float64
최저기온(℃)    float64
최고기온(℃)    float64
dtype: object
df.info()
<class 'pandas.core.frame.DataFrame'>
RangeIndex: 42473 entries, 0 to 42472
Data columns (total 5 columns):
 #   Column   Non-Null Count  Dtype
---  ------   --------------  -----
 0   날짜       42473 non-null  object
 1   지점       42473 non-null  int64
 2   평균기온(℃)  41717 non-null  float64
 3   최저기온(℃)  41714 non-null  float64
 4   최고기온(℃)  41714 non-null  float64
dtypes: float64(3), int64(1), object(1)
memory usage: 1.6+ MB
df.describe()

"\t1907-10-01".strip()
'1907-10-01'
# 날짜 이상 데이터 제거
df["날짜"] = df["날짜"].map(lambda x: x.strip())
# df["날짜"].str.strip()
# df["날짜"].str[1:]
df.columns
Index(['날짜', '지점', '평균기온(℃)', '최저기온(℃)', '최고기온(℃)'], dtype='object')
# 컬럼명 변경
df.columns = ["날짜", "지점", "평균기온", "최저기온", "최고기온"]
df.head()
# 결측치 확인
df.isna().sum()
날짜        0
지점        0
평균기온    756
최저기온    759
최고기온    759
dtype: int64
# 최저기온이 Null인 데이터만 필터링: true인 데이터만 표시
df[df["최저기온"].isna()]

- 1950년대 6.25 전쟁으로 당시 데이터가 수집되지 않은 것으로 추정
- 1950/06/25 ~ 1953/07/27
데이터 분석
서울이 가장 더웠던 날
- 서울의 최고 기온이 가장 높았던 날
df["최고기온"].max()
39.6
df["최고기온"].idxmax()
40051
df.loc[40051]
날짜      2018-08-01
지점             108
평균기온          33.6
최저기온          27.8
최고기온          39.6
Name: 40051, dtype: object
df.sort_values("최고기온", ascending = False)

내 생일의 기온 변화
# 생일 데이터 추출 ver1
df[df["날짜"].str.endswith("08-27")]

ndf = df.copy()
# 생일 데이터 추출 ver2
ndf["date"] = pd.to_datetime(ndf["날짜"], format = "%Y-%m-%d")
ndf.head()

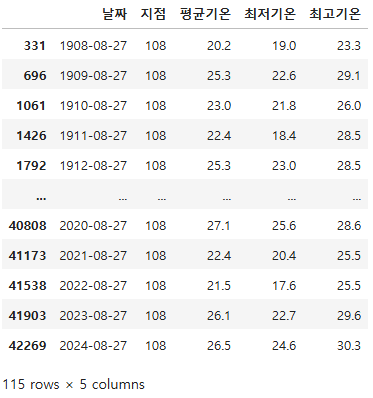
birthday_df = ndf[(ndf["date"].dt.month == 8) & (ndf["date"].dt.day == 27)]
birthday_df.head()

birthday_df.tail()

# 시각화
fig = plt.figure(figsize = (20, 10))
ax = fig.add_subplot(1, 1, 1)
ax.plot(birthday_df["date"].dt.year, birthday_df["최고기온"], "hotpink", label = "최고기온")
ax.plot(birthday_df["date"].dt.year, birthday_df["최저기온"], "skyblue", label = "최저기온")
ax.legend()
ax.set_title("내 생일의 기온 변화 그래프", size = 20)
plt.show()

# 히스토그램
fig = plt.figure(figsize = (20, 10))
ax = fig.add_subplot(1, 1, 1)
ax.hist(birthday_df["최고기온"], color = "brown")
ax.set_title("생일 최고 기온 히스토그램", size = 20)
plt.show()

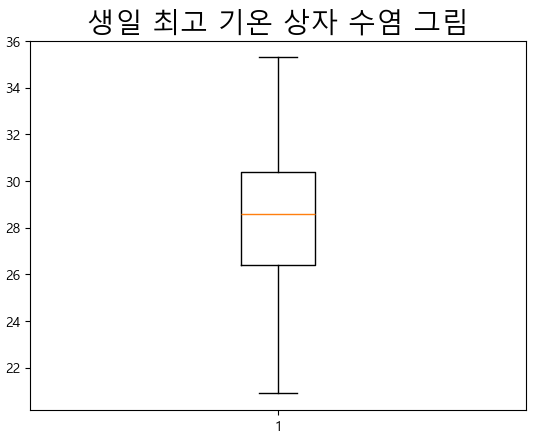
fig = plt.figure()
ax = fig.add_subplot(1, 1, 1)
ax.boxplot(birthday_df["최고기온"].dropna())
ax.set_title("생일 최고 기온 상자 수염 그림", size = 20)
plt.show()
q3, q1 = np.percentile(birthday_df["최고기온"].dropna(), [75, 25])
q3
30.375
q1
26.424999999999997
iqr = q3 - q1
iqr
3.950000000000003
outlier = q1 - (1.5 * iqr)
outlier
20.499999999999993
# 이상치가 없으므로 이상치 값이 나오지 않음
birthday_df[birthday_df["최고기온"] < outlier]

df.dtypes
날짜       object
지점        int64
평균기온    float64
최저기온    float64
최고기온    float64
dtype: object
df.loc[df["날짜"].str[5:] == "08-27", :]
df["날짜"].str[5:]
0        10-01
1        10-02
2        10-03
3        10-04
4        10-05
         ...
42468    03-14
42469    03-15
42470    03-16
42471    03-17
42472    03-18
Name: 날짜, Length: 42473, dtype: object'07_Data_Analysis' 카테고리의 다른 글
| 18_외국인 관광객 데이터 분석 (0) | 2025.03.20 |
|---|---|
| 17_유투브 랭킹 데이터 분석 (0) | 2025.03.19 |
| 15_카이제곱 검정(교차분석) (0) | 2025.03.19 |
| 14_ANOVA(ANalysis Of VAriance) (2) | 2025.03.19 |
| 13_T-Test (0) | 2025.03.19 |